Data-logging
Read more about the program in the user manual, found in the menu DOWNLOAD
SteViSens® 62 collects data from each of the six axes 5,000 times per second.
Data are stored in the internal memory, for later output to an USB-stick.
When an USB-stick is inserted, data-collection and displaying of data in the LED bargraph stops temporarily, and data collected within the last 10 seconds
are stored on the USB-stick.
This phase is indicated by only the top left-side red LED is turned ON.
When storing data is completed, SteViSens® 62 returns to normal display mode.
You can now remove the USB-stick.
For a second data dump just insert the USB-stick again.
The first data dump are stored in a folder named '1', the second in folder '2', etc.
Maximum numbers of folders are 99.
It is recommended to delete datafiles on the USB-stick after each session, to avoid mixing data from two different vehicles.
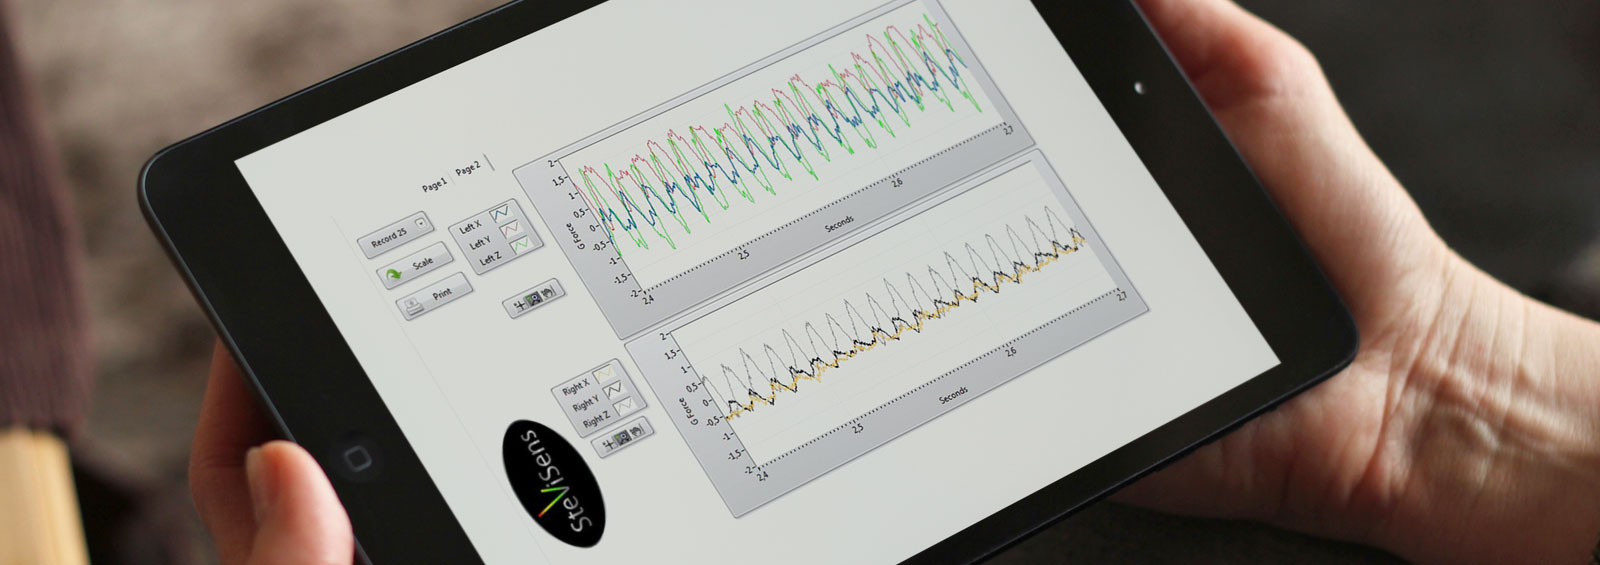
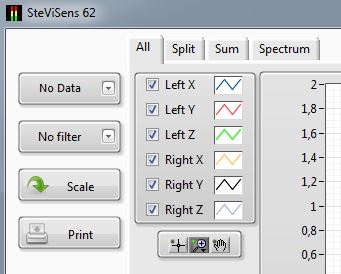
PC program for analyzing data.
The program offers a myriad of opportunities to analyze the collected data.
Data from the two sensors can be displayed together in a picture or for each sensor.
There can be zoomed in and out, each of the 6 axis can be turned ON/OFF.
For each sensor values from the three axes can be summed and displayed as a single result,
just like the LED bargraph during test drive.
Filters may be inserted to remove unwanted high frequencies, and display an spectral distribution of frequencies in the Measurement.